Most Prominent Concepts Within the Greater Miami Resilience Plans
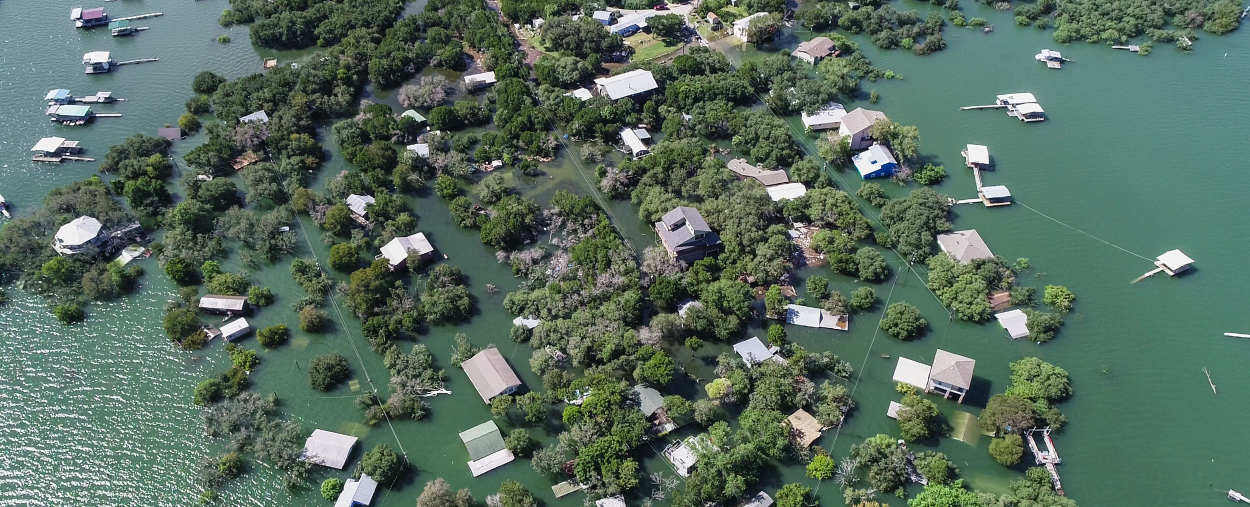
We have systematically reviewed 22 resilience plans in the Greater Miami region, including those from the South Florida Water Management District, Southeast Florida Regional Climate Change Compact, Miami-Dade County, City of Miami, Miami Beach, and other local Councils. The diagram features the most prominent concepts from across these plans, revealing the overarching sentiments and priorities of local and regional authorities.
Clusters of Concepts Reveal Sectoral Orientation of the Resilience Plans
While analyzing the 22 resilience plans in the Greater Miami region, we identified major clusters based on their core characteristics and associations. This interactive chart helps improve understanding of which sectors and themes (e.g., environment and climate, infrastructure and mobility, land and housing, health and equity, water and energy, governance) these plans focus on, as well as those that receive less emphasis.
Key Strategies and Solutions Proposed through Resilience Plans
We analyzed the range of strategies and solutions proposed in the resilience plans and ranked them based on frequency of occurrence. Given that drivers of resilience are complex, interconnected, and mutually reinforcing, we deconstruct the relationships and flows between resilience solutions. These resilience strategies encompass both nature-based solutions (e.g., expanding tree canopy, water conservation, restoring critical habitats, and beach nourishment) and re-engineering infrastructure systems (installing flood barriers, raising roads, and improving stormwater drainage). The dynamic chart reinforces that climate adaptation is not a linear process, and the complex dependencies and trade-offs involved across systems and strategies in resilience planning.
Which Indicators Would be Useful to Visualize in the New Resilience Tool
To address the knowledge gap in reconciling the diverse capabilities, goals, scope, and limitations of various resilience decision-support tools, we performed a critical assessment of 30 selected climate resilience tools in the U.S. We identified over 264 indicators across these tools and organized those into six domains (social, economic, environmental, institutional, infrastructure, and health). The Radar chart shows the percentage of indicators falling into each domain. It provides essential guidance for designing future resilience tools, outlining the types of indicators that should be prioritized while addressing existing knowledge gaps.
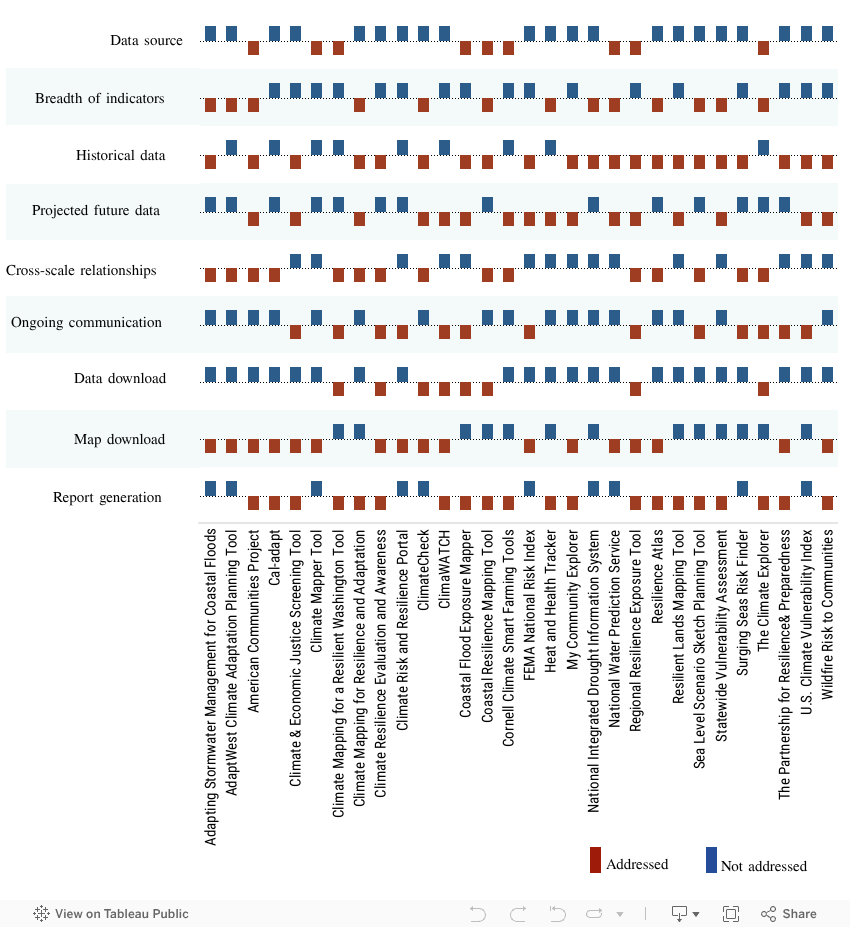
Ensuring a Robust Decision-Support Capability on the Resilience Tool
Analyzing the 30 selected climate resilience tools in the U.S., we are examining which features enhance user engagement and trust with resilience tools that could support collaborative decision-making. Assessment of existing tools on a range of decision-support criteria informs our design framework and the scope for innovation in the new resilience tool we are developing through this project.